What Are The DOW And The S&P 500?
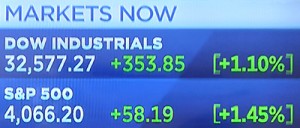
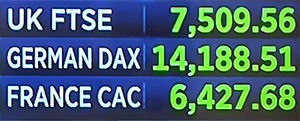
You frequently hear about the DOW and the S&P 500 in the news. And when they are up, as pictured above, the commentators say the stock market is up and things are good.
But recently, they’ve been showing red numbers, because the market has been down. And people worry as the newscasters frown and report, “Oh, the DOW is down 450 points today.” And the S&P 500 is down 55 points too… and that’s a bad thing.
No doubt you’ve heard about the S&P 500 and the DOW for years (also known as the DOW 30 or the Dow Jones Industrial Average). Because when you tune into any news program, they will eventually mention them in the stock market report.
So what are these things really? What is the S&P 500? And what is the DOW?
THEY’RE JUST A LIST OF STOCKS
Well, technically, they’re called market indexes. But as a starting point, you can just think them as lists of stocks.
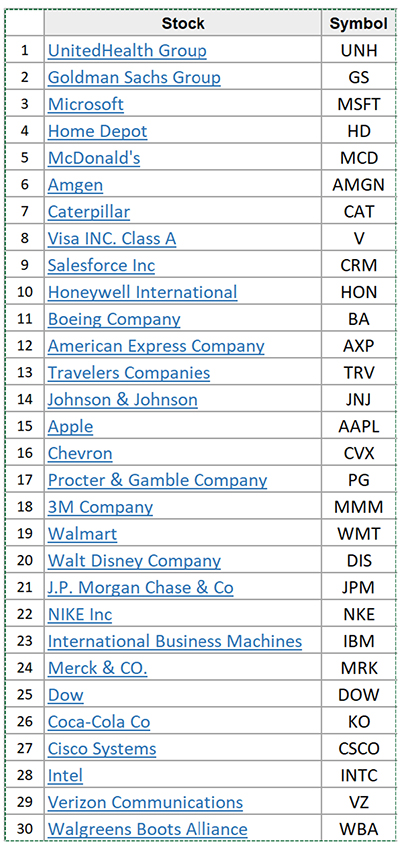
For example, the S&P 500 index you hear about all of the time is just a list of the top 500 companies’ stocks in the US. And the DOW 30 is just a list of thirty of the most widely traded US companies’ stocks.
.
| Note that the S&P in the S&P 500 stands for the market research firm Standards and Poor’s. And DOW is named after Charles Dow, who first developed a stock index back in 1894. Two years later, he partnered with Edward Jones to establish the Dow Jones Industrial Average (the “Dow”). |
Figure 1: List Of Stocks In The DOW 30 Market Index
We won’t list the 500 stocks in the S&P 500 here because that would be unwieldy. But you would recognize many of them also. For example, Apple, Inc. (AAPL) is one of them that we refer to later. And you can see the full list here – https://en.wikipedia.org/wiki/List_of_S%26P_500_companies.
So in general, we can think of these market indexes, the DOW and the S&P 500, as lists of stocks that fit a certain criteria, i.e. top 500 stocks, or 30 most traded stocks, etc.
Of course there’s more to these indexes than just that. For one, they’re used by many fund managers to create inexpensive funds that you and I can invest in. And two, they’re used to summarize and tell the overall stock market direction – i.e. is it going up or down. So let’s look into these other uses, starting with the funds.
MARKET INDEXES HELP CREATE INEXPENSIVE FUNDS
So how do indexes help create cheap funds? Well, just think about a fund manager and what he has to do. He has to research what stocks to buy for his fund by looking into the performance of many different companies. And that performance is changing all of the time.
And he has to figure out how much to buy of each stock he selected. And that all takes a lot of time and money. Which means that actively managed funds like this may charge you 1% or more to cover the cost of all of that work.
So instead, some funds take a shortcut, bypass all that research, and just use one of the indexes like the DOW or the S&P 500 as a guide for what to buy. This makes the fund managers job much easier. And so the fund can charge much lower expenses to you and me.
For example, one of the lowest I’ve seen is the Vanguard Total Stock Market Index Fund ETF (VTI). It has a miniscule .03% expense ratio. That’s virtually free of charge.
And you’ll see many other low cost Exchange Traded Funds (ETFs) with expense ratios in the range of only .05% to .30% too. And they can do that because they are indexed funds, meaning that they are taking this shortcut of using the indexes to guide them.
So let’s look into creating a fund with the DOW 30 market index. Let’s see how simple that might be.
LET’S CREATE A FUND
Okay, so we’re dealing with thirty 30 stocks. And our fund manager wants to mimic the DOW. So treating everything equal, he would make sure each stock in the list was 3.33% of his fund.
So if he started the fund with a million dollars (we’ll call it the Tiny DOW Equal Weighted 30 Fund), he would buy $33,333 of each of the 30 stocks in the list.
He would buy $33,333 of Microsoft stock and, just the same, he would buy $33,333 of Coca Cola, and $33,333 of each and every other companies stock on the list. And if he did that he could say his Tiny DOW Equal Weighted 30 Fund tracked the equal weighted DOW 30 index.
That’s pretty easy to do, right.
Now that said, many indexes (and funds that use them) refine this simple process just bit. But it’s still easy for fund managers to follow, and still cheap to do.
And that refinement is to take company size into consideration.
For example, Microsoft is a $2 trillion dollar company, while Coca Cola is not quite a $300 billion dollar company. So many indexes give more weight to the larger corporations than they do the smaller ones in the list. And that makes some sense as they probably have more influence over the market, and economy, than the smaller companies’ stocks.
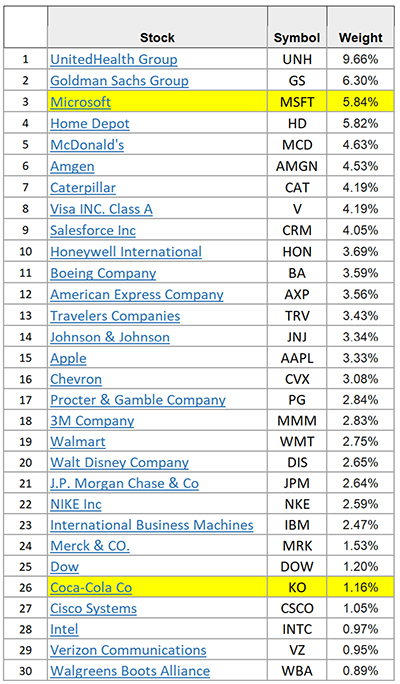
So here is the weighted DOW 30 list.
Figure 2: Weighted DOW 30 Market Index
And you can see in this case that the DOW 30 would weight Microsoft at 5.84% (instead of the equal weighted 3.33%), and Coca Cola at only 1.16% (instead of 3.33%). Or about 6 times more than Coke. So let’s just round those numbers for now and go with 6% for Microsoft and 1% for Coke to keep the math easy.
Now, using that weighted list, our fund manager would buy $60,000 ($1,000,000 x .06 = $60,000) of Microsoft Stock instead of $33,333. And he would just buy $10,000 ($1,000,000 x .01 = $10,000) of Coca Cola stock, instead of $33,333.
And he would buy whatever weighted percent of each of the other 28 stocks in our weighted DOW 30 list.
So that’s still pretty easy for the fund manager. After all, the list tells him what stocks to buy and how much of each. So that makes the whole thing pretty brainless, because all of the thinking has already been done for him.
And just to emphasize that point, note that the indexes are so valuable that funds claiming to track them actually have to pay a fee to the indexer that creates and maintains them.
So anyhow, that’s why indexed funds and Exchange Traded Funds (ETFs) can be so cheap, and how indexes help them do it.
THEY SUMMARIZE AND TELL THE STOCK MARKET DIRECTION
Now, we said there’s another useful thing going on with market indexes like the DOW and the S&P 500. And that is to summarize and tell the overall stock market direction – i.e. is it going up or down.
And that’s actually the original purpose the first index was created for, way before funds and ETFs were much thought of.
Because a market index can boil down all of the millions of daily stock transactions, up and down, into just one number. Then if the number is bigger than it was yesterday, that’s a good thing. And if it’s lower than yesterday, that’s a bad thing.
So you might think of an “index” as a reference point. They let us compare to a base index (yesterday’s number, for example) to today’s number to see if the stocks have gone up or down, and by how much.
And they serve as a reference point for our individual stocks, too. For example, it we own Microsoft (MSFT), and it’s up by 1.5% today, but the S&P 500 is only up 1%, then we are “beating the market.”
.
| DEFINITION: An index is an indicator or measure of something. In finance, it typically refers to a statistical measure of change in a securities market. Source: Investopedia. |
And it’s all done in one number.
Just think about that. As I write this, there are over 388,523,772 transactions on the DOW today. And the daily average is 403,936,564. Wow. So over 400 million buys and sells, wins and losses in one day.
So how do we boil all that down to one number?
LET’S CALCULATE THE S&P 500
Well, let’s give it a go and see if we can do it. We’ll try to do something similar to the weighted S&P 500. Because the S&P 500 can pretty much represent the overall market.
So we can take a stock on the list, and multiply the total number of shares outstanding by the current price. For example, Apple has 16.2 billion shares and it’s price today is $149.24. So multiplied, that gives $2.4 trillion (16,200.000.000 X $149.24 =$2,417,688,000,000).
By doing this, we’ve valued all of the company’s stock shares to the current price.
And we do that for the other 499 stocks on the list too. Then we add up all of those numbers. And hey, that gives us one big number that summarizes the market.
Our number for the S&P 500 today is 40,400,000,000,000 ($40 trillion 400 billion).
We did it!
Now let’s say we did that yesterday too, and that number was 40,000,000,000,000 ($40 trillion).
Cool! So we can tell the market is up 1% from yesterday. Because now we have just one number we can use to say if the 500 stocks in our list are up or down from yesterday.
But do you see a problem here? Sure, we’ve got just one number that summarizes the market. And we can compare it from day to day to see the market direction. But it’s kind of unwieldy because it’s so big.
And of course the real numbers would be a lot messier. Like yesterday’s number might have been 40,001,025,671,392 and today’s might really be 40,412,438,146,693, which means the market went up by 411,412,475,301.
And just for fun, can you imagine a newscaster reporting that, saying, “Hey, good news on the stock market today, folks, the S&P 500 was up by four hundred and eleven billion four hundred twelve million four hundred seventy-five thousand three hundred and one points for a 1.0% gain!”
Like I said, unwieldy.
JUST ONE MORE STEP AND WE’VE GOT IT
Okay, so the indexers do one more thing to the number. They divide it by a secret sauce divisor to make it smaller and less unwieldy. And this is where it becomes more like the S&P 500 index that we’re used to.
Now, alert readers will see we’re really just trying to do something like a weighted average here. Okay, so that seems simple enough. But the tricky part is the secret sauce divisor (more on that in a minute).
So we’re just going to use a simple divisor with no secret sauce. We’re going to divide our numbers by an arbitrary 10,000,000,000 (ten billion).
And that makes yesterday’s number 4000 and today’s number 4040. So we can just say, “Hey, the S&P 500 index is up 1% from 4000 to 4040 today.”
Now that’s more like it. Because we really don’t need to know the fully multiplied out exact extended numbers. We just need to have a simple, scaled down number that gives us the overall effect and direction of the stock market to refer to.
So we still have just one number that summarizes all the ups and downs of the 500 stocks. And we can compare it from day to day as an index, to see if the market is up or down.
And whew – it’s a lot less clumsy. And in fact, it’s pretty close to the real S&P 500 number, which was 4066 today as I wrote this.
So that’s the other important point about these market indexes. They give us a single, simple, not too big number to track the direction of the markets.
ABOUT THAT SECRET SAUCE
Now, about that secret sauce divisor number I mentioned that the indexers use. Well, it’s more technical than the arbitrary 10,000,000,000 we used. Because it’s made up of adjustments that consider the effects of stock splits, spinoffs, special dividends and other factors that could affect the overall index. And we probably don’t need to go there.
Instead, I think we can just wrap it up and say we see how market indexes like the S&P 500 can help us track the direction of the market. And we get the general idea of how they are calculated.
So in conclusion let’s get back to our original question, which was what are the DOW and the S&P 500? And we’ve learned that they are market indexes. And in simple terms, we can think of them as lists of stocks.
But there’s also more to them than that. Because they’re also very useful to create inexpensive indexed funds like ETFs for you and I to invest in. And finally, they give us a single number, a reference point, to track the direction of the markets they represent.
I’d say that’s all pretty useful, wouldn’t you? And hats off to Charles Dow who created the first index all the way back in 1894.
To your health and prosperity – John
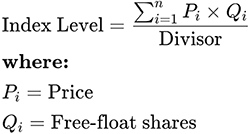
EXTRA CREDIT: Here’s the calculation for the S&P 500, but don’t black out looking at it. You can just think of it overall as a weighted average of the 500 stocks and their prices.
Also note that this number is constantly calculated throughout the day as the markets change.
BRAGGING RIGHTS: By the way, if anyone asks you what you were doing today, you can just casually mention that you were busy calculating the S&P 500 Weighted Market Index. Hmmm… no need to tell them that we took a shortcut on the divisor ![]() .
.
INTERNATIONAL INDICES: We just described two key US market indexes in this article. But of course there are many others around the world.
.
One of my favorites, for example, is the United Kingdom FTSE, called the “Footsie.”
And then there’s the German DAX, the France CAC and many others.
You can see more of these International Indices at https://markets.businessinsider.com/indices?op=1.
BACK IN THE USA: Another important US index is the Nasdaq market index. It’s a list of 3000 companies, many of which are in technology, and / or younger, fast-growing companies. And it’s traded on the Nasdaq exchange.
It’s actually ranked second among the stock exchanges, based on size. I left it out earlier to keep things simple, and not discuss too many things at once. But it’s an important index, and exchange, and you’ll hear about it in the financial news often.
By the way, Nasdaq is an acronym for National Association of Securities Dealers Automated Quotations Stock Market. Say that fast ten times.
The exchange is based in New York City.
